Connect with us

Economy

Nigeria’s Internally Generated Revenue By States

Published

on

land use charges
  • Nigeria’s Internally Generated Revenue By States

The Internally Generated Revenue (IGR) is one of the sources of revenue available to the Nigerian government and generated within government jurisdiction.

Nigeria generated a total sum of N1.168 trillion in 2018, with Lagos emerging the biggest contributor with IGR of N382 billion.

The country generated N903,151,832,126.91 in taxes from 669,218,363,015.04 Paye in 2018.

Still, Nigeria’s revenue to GDP remains low given the size of the economy. Presently, stood at 6.1 percent to GDP of US$375.8 billion, one of the lowest in the world.

Here is a breakdown of Nigeria’s Internally Generated Revenue by states as released by the National Bureau of Statistics for the fourth quarter of 2018.

State/FCT PAYE Total Tax Total IGR(Tax+MDA rev)
Abia                                 5,138,484,832.97                     7,957,435,051.48                                   14,834,904,447.49
Adamawa                                 3,929,964,737.77                     4,699,886,639.54                                     6,204,876,665.62
Akwa Ibom                               17,646,936,782.24                    22,081,159,675.49                                   24,210,810,102.72
Anambra                                               8,894,893,799.97                    14,287,648,280.67                                   19,305,267,646.94
Bauchi                                 7,422,447,630.99                     8,280,655,854.48                                     9,690,832,177.58
Bayelsa                               11,313,020,578.25                    13,243,149,522.67                                   13,636,545,716.78
Benue                                 7,964,760,000.70                     8,741,992,109.88                                   11,215,482,725.16
Borno                                 3,822,329,089.08                     5,047,673,570.44                                     6,524,300,904.06
Cross River                                 7,969,863,557.78                    13,473,446,074.19                                   17,552,112,937.09
Delta                               42,308,208,426.19                    49,826,576,715.60                                   58,439,598,672.31
Ebonyi                                 3,119,084,779.97                     5,277,967,099.24                                     6,144,587,065.65
Edo                               12,518,514,074.62                    20,898,795,728.64                                   28,425,496,842.23
Ekiti                                 4,149,195,425.69                     5,949,790,554.13                                     6,465,374,250.65
Enugu                                 9,155,530,851.00                    12,531,044,866.00                                   22,145,937,216.00
Gombe                                 3,009,364,528.37                     4,096,658,307.58                                     7,343,549,621.53
Imo                                 6,837,672,013.26                    11,081,185,393.90                                   14,884,271,810.31
Jigawa                                 3,556,275,400.00                     7,334,284,092.70                                     9,246,250,836.03
Kaduna                               14,103,431,098.91                    16,738,368,388.07                                   29,446,386,924.74
Kano                               14,903,246,555.59                    32,272,930,308.62                                   44,107,375,284.25
Katsina                                 5,258,646,653.00                     6,101,394,127.00                                     6,961,870,329.00
Kebbi                                 2,707,998,708.70                     3,886,888,103.92                                     4,881,961,005.78
Kogi                    7,121,716,683.79                     8,852,502,190.02                                   11,334,113,743.55
Kwara                                 6,000,301,815.08                     8,884,487,875.94                                   23,046,944,295.60
Lagos                             239,447,662,835.80                  324,627,015,852.81                                 382,181,548,627.13
Nassarawa                                 6,664,473,705.60                     7,058,008,167.68                                     7,566,920,656.91
Niger                                 8,140,882,536.90                    10,191,292,585.10                                   10,432,190,956.63
Ogun                               37,873,799,416.99                    52,930,019,342.02                                   84,554,199,593.67
Ondo                                 8,773,235,465.99                    14,783,127,763.10                                   24,788,059,725.53
Osun                                 6,246,936,579.53                     7,603,522,076.74                                   10,381,663,677.98
Oyo                               12,529,761,756.92                    20,175,754,639.06                                   24,635,074,074.49
Plateau                                 6,416,505,782.90                     9,210,439,308.14                                   12,726,479,548.41
Rivers                               57,101,624,159.72                    71,354,836,001.66                                 112,780,373,912.23
Sokoto                                 8,594,939,362.95                    17,265,416,966.45                                   18,762,009,020.05
Taraba                                 2,537,683,154.04                     2,817,002,264.37                                     5,968,809,583.11
Yobe                                 2,176,889,019.28                     2,518,495,174.18                                     4,382,259,456.05
Zamfara                                 3,224,262,029.41                     5,551,317,800.58                                     8,206,695,592.14
 Total exc FCT                          608,580,543,829.95              837,632,168,472.09                           1,103,415,135,645.40
FCT                               60,637,819,185.09                    65,519,663,654.82                                   65,519,663,654.82
 Total inc FCT                          669,218,363,015.04              903,151,832,126.91                           1,168,934,799,300.22

Is the CEO/Founder of Investors King Limited. A proven foreign exchange research analyst and a published author on Yahoo Finance, Businessinsider, Nasdaq, Entrepreneur.com, Investorplace, and many more. He has over two decades of experience in global financial markets.

Continue Reading
Comments

Economy

IMF Report: Nigeria’s Inflation to Dip to 26.3% in 2024, Growth Expected at 3.3%

Published

on

IMF global - Investors King

Nigeria’s economic outlook for 2024 appears cautiously optimistic with projections indicating a potential decrease in the country’s inflation rate alongside moderate economic growth.

The IMF’s revised Global Economic Outlook for 2024 highlights key forecasts for Nigeria’s economic landscape and gave insights into both inflationary trends and GDP expansion.

According to the IMF report, Nigeria’s inflation rate is projected to decline to 26.3% by the end of 2024.

This projection aligns with expectations of a gradual easing of inflationary pressures within the country, although challenges such as fuel subsidy removal and exchange rate fluctuations continue to pose significant hurdles to price stability.

In tandem with the inflation forecast, the IMF also predicts a modest economic growth rate of 3.3% for Nigeria in 2024.

This growth projection reflects a cautious optimism regarding the country’s economic recovery and resilience in the face of various internal and external challenges.

Despite the ongoing efforts to stabilize the foreign exchange market and address macroeconomic imbalances, the IMF underscores the need for continued policy reforms and prudent fiscal management to sustain growth momentum.

The IMF report provides valuable insights into Nigeria’s economic trajectory, offering policymakers, investors, and stakeholders a comprehensive understanding of the country’s macroeconomic dynamics.

While the projected decline in inflation and modest growth outlook offer reasons for cautious optimism, it remains essential for Nigerian authorities to remain vigilant and proactive in addressing underlying structural vulnerabilities and promoting inclusive economic development.

As the country navigates through a challenging economic landscape, concerted efforts towards policy coordination, investment promotion, and structural reforms will be crucial in unlocking Nigeria’s full growth potential and fostering long-term prosperity.

Continue Reading

Economy

South Africa’s March Inflation Hits Two-Month Low Amid Economic Uncertainty

Published

on

South Africa's economy - Investors King

South Africa’s inflation rate declined to a two-month low, according to data released by Statistics South Africa.

Consumer prices rose by 5.3% year-on-year, down from 5.6% in February. While this decline may initially suggest a positive trend, analysts caution against premature optimism due to various economic factors at play.

The weakening of the South African rand against the dollar, coupled with drought conditions affecting staple crops like white corn and geopolitical tensions in the Middle East leading to rising oil prices, poses significant challenges.

These factors are expected to keep inflation relatively high and stubborn in the coming months, making policymakers hesitant to adjust borrowing costs.

Lesetja Kganyago, Governor of the South African Reserve Bank, reiterated the bank’s cautious stance on inflation pressures.

Despite the recent easing, inflation has consistently remained above the midpoint of the central bank’s target range of 3-6% since May 2021. Consequently, the bank has maintained the benchmark interest rate at 8.25% for nearly a year, aiming to anchor inflation expectations.

While some traders speculate on potential interest rate hikes, forward-rate agreements indicate a low likelihood of such a move at the upcoming monetary policy committee meeting.

The yield on 10-year bonds also saw a marginal decline following the release of the inflation data.

March’s inflation decline was mainly attributed to lower prices in miscellaneous goods and services, education, health, and housing and utilities.

However, core inflation, which excludes volatile food and energy costs, remained relatively steady at 4.9%.

Overall, South Africa’s inflation trajectory underscores the delicate balance between economic recovery and inflation containment amid ongoing global uncertainties.

Continue Reading

Economy

Discontent Among Electricity Consumers as Band A Prioritization Leads to Supply Shortages

Published

on

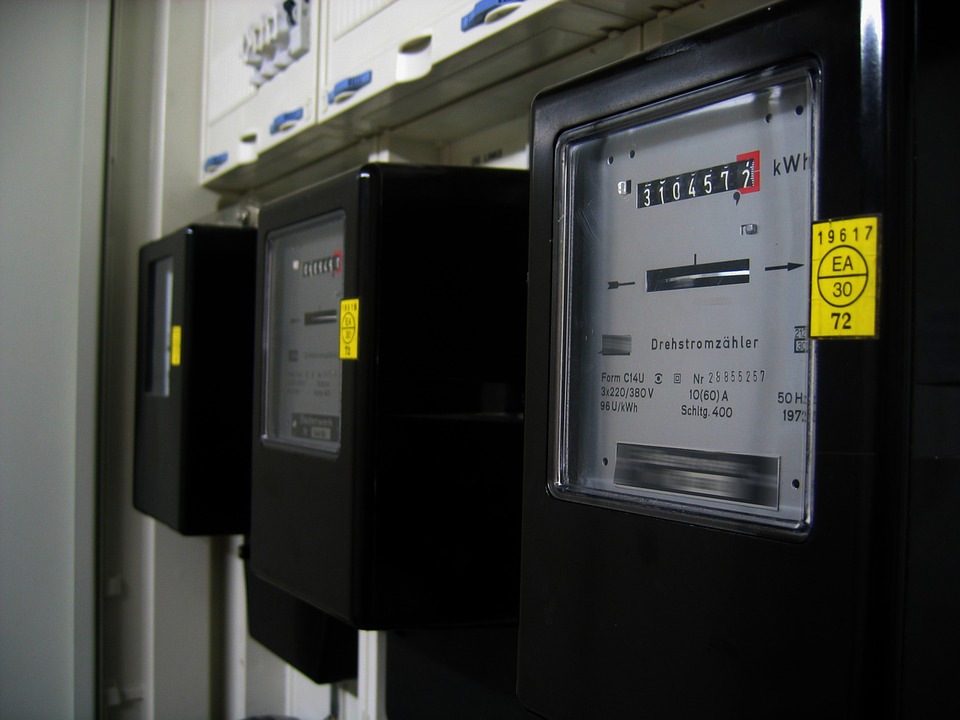
In Nigeria, discontent among electricity consumers is brewing as Band A prioritization by distribution companies (DisCos) exacerbates supply shortages for consumers in lower tariff bands.

The move follows the Nigerian Electricity Regulatory Commission’s (NERC) decision to increase tariffs for customers in Band A, prompting DisCos to focus on meeting the needs of Band A customers to avoid sanctions.

Band A customers, who typically receive 20 to 24 hours of electricity supply daily, are now benefiting at the expense of consumers in Bands C, D, and E, who experience significant reductions in power supply.

The situation has ignited frustration among these consumers, who feel marginalized and neglected by DisCos.

Daily Trust investigations reveal that many consumers in lower tariff bands are experiencing prolonged power outages, despite their expectations of a minimum supply duration.

Residents like Christy Emmanuel from Lugbe, Abuja, and Damilola Akanbi from Life Camp are lamenting receiving less than the promised hours of electricity, rendering it ineffective for their daily needs.

Adding to the challenge is the low electricity generation, forcing DisCos to ration power across the grid.

As of recent records, only 3,265 megawatts were available, leading to further difficulties in meeting the demands of all consumers.

The prioritization of Band A customers has been confirmed by officials from DisCos, citing directives from the government to avoid sanctions from NERC.

An anonymous official from the Kaduna Electricity Distribution Company highlighted the pressure from the government to ensure Band A customers receive the required supply, even if it means neglecting other bands.

Meanwhile, the Transmission Company of Nigeria (TCN) has denied reports blaming it for power shortages to Band A customers. General Manager Ndidi Mbah clarified that recent outages were due to technical faults and adverse weather conditions, outside of TCN’s control.

Experts have criticized the DisCos’ prioritization strategy, arguing that it neglects the needs of consumers in lower tariff bands. Bode Fadipe, CEO of Sage Consulting & Communications, emphasized that DisCos cannot ignore the financial contributions from these bands, which sustain the sector.

Chinedu Amah, founder of Spark Nigeria, urged for optimized supply across all bands, emphasizing the importance of improving service levels for all consumers.

As discontent grows among electricity consumers, calls for fair distribution of power and equitable treatment from DisCos are gaining momentum.

The situation underscores the need for regulatory intervention to address the concerns of all stakeholders and ensure a balanced approach to electricity distribution in Nigeria

Continue Reading
Advertisement


Advertisement
Advertisement
Advertisement

Trending