Forex
GBPUSD Analysis

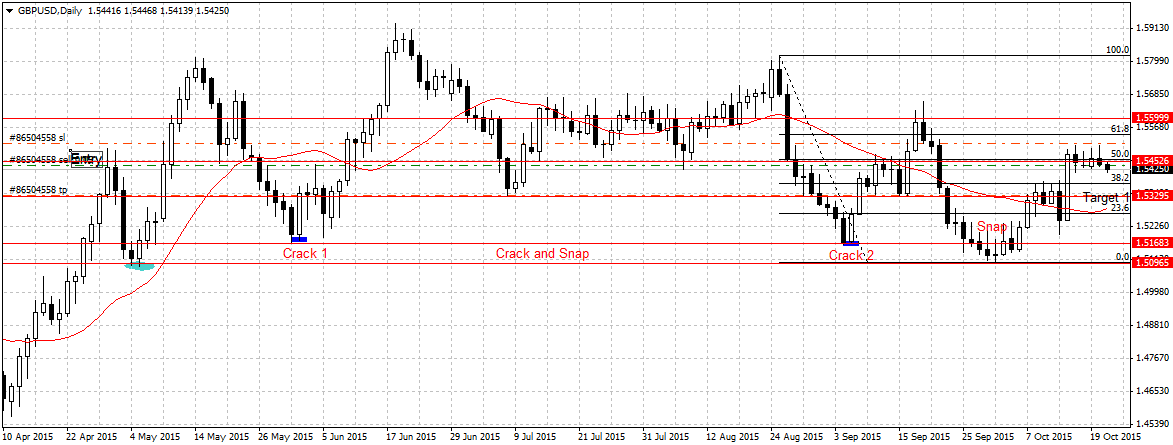
Click on the chart for better view.
If you have been following GBPUSD price movement for a while you would have noticed that the pair seems to have established a sort of rhythmic pattern that if carefully followed one would have tapped into its down pour.
Since the crack and snap was established two weeks ago, the currency pair has been on the rise, and was further strengthened by reduced unemployment claims (5.4 percent) and US poor economic data released Wed. Oct 14. Hence, breaking 1.5452 for the first time in 3 weeks.
The surge in price level create renewed buying interest which saw the pair extent its gains by 248 pips on Wed. Oct 14 but failed to sustain 1.5452 after 3 attempts, on Friday Oct 15, a gravestone doji was formed which further confirmed buying power is fading or that the market is rejecting higher price at this time.
However, on Monday, the market opened at 1.5434 below last week Friday 1.5438 open price, and yet to break 1.5452 price level, our current preliminary resistance.
Based on this, I will be looking to sell GBPUSD if price fall below (1.5431) 20 days moving average (MA) on 4 hours time-frame, with the aim of exiting prior to Bank of England’s governor, Mark Carney, meeting before the Treasury Select Committee, in London on Tuesday.
Also, fundamentally I do not see GBPUSD breaking 1.5599 just yet.